


A double bar graph is a type of statistical chart that displays two sets of data side by side using pairs of bars, making it easy to compare two categories across multiple groups at once. Double bar graphs appear regularly in AMC 8 data interpretation problems — typically in the first fifteen questions — and reward students who can read values accurately, calculate differences and totals, and identify trends quickly under timed conditions. This guide explains exactly what a double bar graph is, how to read a double bar graph correctly, common mistakes to avoid, and includes worked examples and AMC 8 style practice problems with full solutions.

What is a double bar graph?
A double bar graph is a bar chart that shows two related data sets on the same axes. Each group on the horizontal axis has two bars — one for each data set — placed side by side. The two bars are typically shown in different colours or patterns, with a legend identifying which colour corresponds to which data set.
The purpose of a double bar graph is comparison. While a single bar graph shows one quantity for each group, a double bar graph allows you to see two quantities simultaneously and compare them directly — both within each group and across different groups.
What does a double bar graph look like?
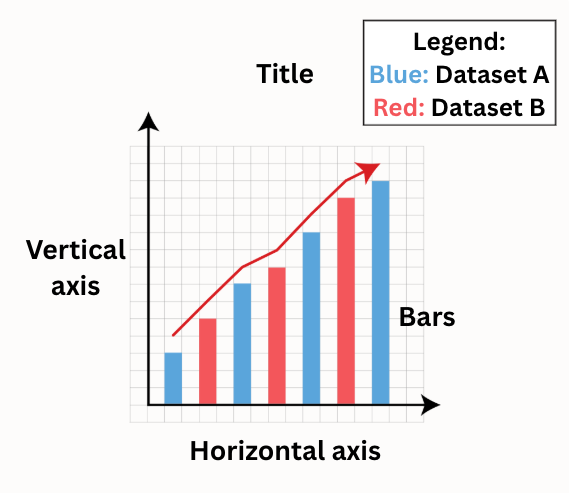
A double bar graph has the following components:
- A horizontal axis labelled with the categories or groups being compared
- A vertical axis labelled with the quantity being measured and its units
- Pairs of bars for each group — one bar per data set, placed next to each other
- A legend identifying which colour or pattern represents which data set
- A title describing what the graph shows
- A consistent scale on the vertical axis
The two bars in each pair are typically touching or very close together to make the comparison within a group visually immediate. A small gap separates each pair from the next.
Double bar graph vs single bar graph
| Feature | Single bar graph | Double bar graph |
|---|---|---|
| Data sets shown | One | Two |
| Bars per group | One | Two |
| Best for | Showing one quantity across groups | Comparing two quantities across groups |
| Requires legend | No | Yes |
| AMC 8 appearance | Questions 1 to 10 | Questions 1 to 15 |
How to read a double bar graph
Reading a double bar graph accurately is the foundation skill for every AMC 8 problem involving this graph type. Students who rush and misread a single value often get the entire problem wrong even if their calculation method is correct.
Step one — read the title and legend first
Before looking at any values, read the title of the graph and the legend. The title tells you what is being measured. The legend tells you which colour bar represents which data set. Misidentifying which bar belongs to which data set is the most common source of error on double bar graph problems.
Step two — check the scale on the vertical axis
Look at the vertical axis and identify the increment between each gridline. If the axis goes from 0 to 50 in steps of 10, each gridline represents 10 units. If a bar reaches the midpoint between two gridlines it represents 5 units. Always check the scale before reading any values — an axis that goes up in steps of 5 rather than 1 will produce values five times larger than expected if misread.
Step three — read each bar by tracing horizontally
For each bar, identify its top edge and trace a horizontal line across to the vertical axis. Read the value where the line meets the axis. If the bar top falls exactly on a gridline, read that value directly. If it falls between gridlines, estimate using the scale.
In AMC 8 problems, bar tops are always placed exactly on gridlines or at clearly readable halfway points — you will never be asked to estimate a value that cannot be read precisely.
Step four — answer the specific question asked
AMC 8 double bar graph questions ask very specific things. Read the question carefully before using the graph. Common question types include:
- What is the value of a specific bar?
- What is the difference between two bars in the same group?
- What is the total of a specific bar across all groups?
- In which group is the difference between the two bars greatest?
- What is the ratio of one bar to another?
- What is the percentage change between two bars?
Each type requires a slightly different approach. Identifying the question type before starting to calculate prevents applying the wrong method.
Double bar graph examples — reading and interpreting
The following double bar graph examples show how to apply the reading steps above and how AMC 8 questions use this graph type.
Double bar graph example 1 — reading values
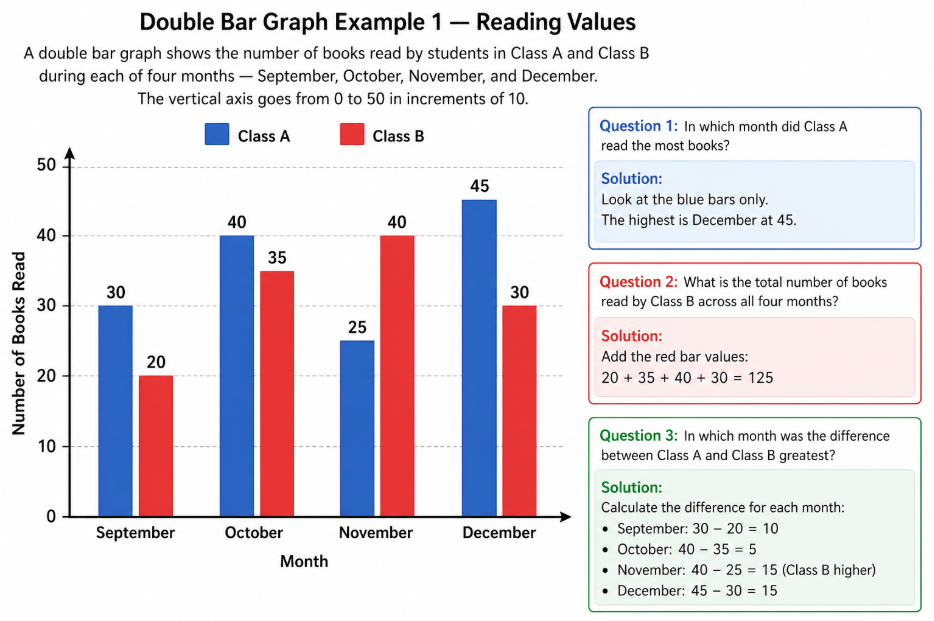
A double bar graph shows the number of books read by students in Class A and Class B during each of four months — September, October, November, and December. The vertical axis goes from 0 to 50 in increments of 10. Class A bars are blue and Class B bars are red.
Values from the graph:
| Month | Class A | Class B |
|---|---|---|
| September | 30 | 20 |
| October | 40 | 35 |
| November | 25 | 40 |
| December | 45 | 30 |
Question 1: In which month did Class A read the most books?
Solution: Look at the blue bars only. The highest is December at 45. Answer: December
Question 2: What is the total number of books read by Class B across all four months?
Solution: Add the red bar values: 20 + 35 + 40 + 30 = 125. Answer: 125
Question 3: In which month was the difference between Class A and Class B greatest?
Solution: Calculate the difference for each month:
- September: 30 – 20 = 10
- October: 40 – 35 = 5
- November: 40 – 25 = 15 (Class B higher)
- December: 45 – 30 = 15
November and December both have a difference of 15.
Answer: November and December (tied)
Key insight: When asked for the greatest difference, calculate all differences rather than trying to identify the answer visually. Two bars that look very different at one group may produce the same difference as two bars that look close at another group once the scale is applied.
Double bar graph example 2 — comparison and ratio
A double bar graph shows the number of goals scored by Team X and Team Y in each of five games. The vertical axis goes from 0 to 8 in increments of 2.
Values:
| Game | Team X | Team Y |
|---|---|---|
| Game 1 | 4 | 2 |
| Game 2 | 6 | 4 |
| Game 3 | 2 | 6 |
| Game 4 | 8 | 4 |
| Game 5 | 4 | 6 |
Question 1: What is the ratio of Team X’s total goals to Team Y’s total goals?
Solution: Team X total: 4 + 6 + 2 + 8 + 4 = 24
Team Y total: 2 + 4 + 6 + 4 + 6 = 22
Ratio: 24:22 = 12:11
Answer: 12:11
Question 2: In how many games did Team Y score more goals than Team X?
Solution: Compare values for each game:
- Game 1: X = 4, Y = 2 — X higher
- Game 2: X = 6, Y = 4 — X higher
- Game 3: X = 2, Y = 6 — Y higher
- Game 4: X = 8, Y = 4 — X higher
- Game 5: X = 4, Y = 6 — Y higher
Y scored more in Games 3 and 5 — two games. Answer: 2
Common mistakes on double bar graph problems
Understanding where errors occur is as useful as knowing the correct method. These are the most frequent mistakes on AMC 8 double bar graph questions.
Misidentifying which bar belongs to which data set is the most common error and the easiest to avoid. Before reading any values, confirm which colour represents which data set from the legend. If both bars in a pair are similar heights, a rushed glance can easily assign values to the wrong data set.
Misreading the scale is the second most common error. An axis that goes up in increments of 5 will produce values five times larger than an axis going up in increments of 1 for a bar of the same visual height. Always check the scale increment before reading the first value.
Calculating the total when asked for the difference or vice versa. Read the question word carefully — total, difference, greater, less than, and ratio all require different calculations from the same values.
Using visual comparison instead of calculation for difference problems. Two bars may look further apart than two other bars but the scale may make the actual difference smaller. Always calculate.
Forgetting to include all groups when finding a total. When a question asks for the total of one data set, add up that data set’s bar value from every group shown on the graph. Missing one group produces an answer that looks plausible but is wrong.
Double bar graphs — AMC 8 style practice problems
These problems are written in the style of actual AMC 8 past contest questions involving double bar graphs.
Problem 1
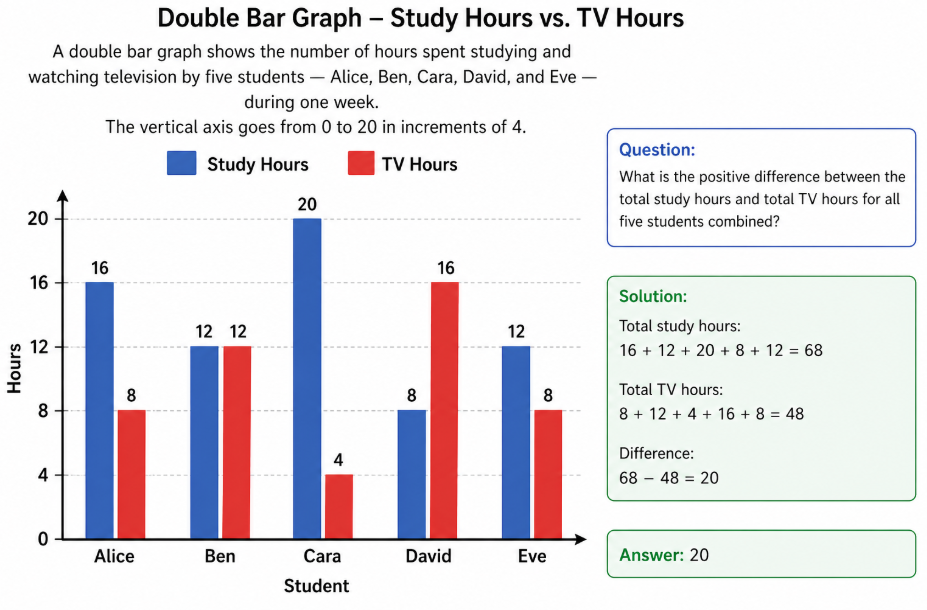
A double bar graph shows the number of hours spent studying and watching television by five students — Alice, Ben, Cara, David, and Eve — during one week. The vertical axis goes from 0 to 20 in increments of 4.
Values:
| Student | Study hours | TV hours |
|---|---|---|
| Alice | 16 | 8 |
| Ben | 12 | 12 |
| Cara | 20 | 4 |
| David | 8 | 16 |
| Eve | 12 | 8 |
Question: What is the positive difference between the total study hours and total TV hours for all five students combined?
Solution: Total study hours: 16 + 12 + 20 + 8 + 12 = 68
Total TV hours: 8 + 12 + 4 + 16 + 8 = 48
Difference: 68 – 48 = 20
Answer: 20
Problem 2
Using the same double bar graph from Problem 1.
Question: For how many students do study hours exceed TV hours?
Solution: Alice: 16 > 8 ✓
Ben: 12 = 12 ✗ (equal, not exceeding)
Cara: 20 > 4 ✓
David: 8 < 16 ✗
Eve: 12 > 8 ✓
Three students have study hours exceeding TV hours.
Answer: 3
Problem 3
A double bar graph shows the number of items sold by Store P and Store Q across four product categories — Books, Electronics, Clothing, and Food. The vertical axis goes from 0 to 60 in increments of 10.
Values:
| Category | Store P | Store Q |
|---|---|---|
| Books | 40 | 30 |
| Electronics | 50 | 60 |
| Clothing | 30 | 20 |
| Food | 60 | 50 |
Question: What fraction of all items sold across both stores were sold by Store P? Express in simplest form.
Solution: Store P total: 40 + 50 + 30 + 60 = 180
Store Q total: 30 + 60 + 20 + 50 = 160
Combined total: 340
Fraction sold by P: 180/340 = 9/17
Answer: 9/17
See Equivalent Fractions Worksheet: Practice Problems and Examples for more on equivalent fractions and how they’re presented in AMC 8.
Problem 4
Using the same double bar graph from Problem 3.
Question: In which category was Store Q’s sales the greatest percentage of Store P’s sales?
Solution: Calculate Store Q as a percentage of Store P for each category:
Books: 30/40 = 75%
Electronics: 60/50 = 120%
Clothing: 20/30 = 66.7%
Food: 50/60 = 83.3%
Electronics has the highest percentage at 120% — this is the only category where Store Q outsold Store P.
Answer: Electronics
Key insight: Percentage comparison problems require dividing Store Q by Store P for each category rather than looking at differences. The category with the smallest gap visually is not always the one with the highest ratio.
Problem 5
A double bar graph shows rainfall in millimetres for City A and City B over six months. The vertical axis goes from 0 to 100 in increments of 20.
Values:
| Month | City A | City B |
|---|---|---|
| January | 60 | 40 |
| February | 40 | 60 |
| March | 80 | 60 |
| April | 60 | 80 |
| May | 40 | 20 |
| June | 80 | 100 |
Question: What is the average monthly rainfall for City A?
Solution: Total for City A: 60 + 40 + 80 + 60 + 40 + 80 = 360
Average: 360 / 6 = 60mm
Answer: 60mm
Problem 6
Using the same double bar graph from Problem 5.
Question: In how many months did the combined rainfall of both cities exceed 120mm?
Solution: Calculate combined rainfall for each month:
January: 60 + 40 = 100
February: 40 + 60 = 100
March: 80 + 60 = 140 ✓
April: 60 + 80 = 140 ✓
May: 40 + 20 = 60
June: 80 + 100 = 180 ✓
Three months exceeded 120mm.
Answer: 3
Problem 7 — harder
A double bar graph shows the scores of two classes on five tests. Class A’s scores are 70, 80, 60, 90, and 75. Class B’s scores are 65, 85, 75, 80, and 70. What is the positive difference between the mean scores of the two classes?
Solution: Mean of Class A: (70 + 80 + 60 + 90 + 75)/5 = 375/5 = 75
Mean of Class B: (65 + 85 + 75 + 80 + 70)/5 = 375/5 = 75
Difference: 75 – 75 = 0
Answer: 0
Key insight: This is a deliberately surprising answer — the two classes have different individual scores but identical means. AMC 8 problems sometimes have answers that do not match the expectation set up by the question. Always complete the calculation rather than assuming the answer before you start.
Double bar graph reference sheet
Reading checklist — use before every AMC 8 double bar graph question
- Read the title
- Read the legend — confirm which colour is which data set
- Check the scale increment on the vertical axis
- Read each bar value by tracing horizontally to the axis
- Re-read the question before calculating
Common question types and approaches
| Question type | Approach |
|---|---|
| Value of a specific bar | Read from graph, check scale |
| Difference between two bars in same group | Read both values, subtract |
| Total of one data set across all groups | Add all bars of that colour |
| Group with greatest difference | Calculate difference for every group, compare |
| Ratio of totals | Calculate both totals, write as simplified ratio |
| Average of one data set | Sum all values, divide by number of groups |
| Percentage one bar is of another | Divide smaller by larger, multiply by 100 |
Frequently Asked Questions
What is a double bar graph? A double bar graph is a statistical chart that shows two related data sets side by side using pairs of bars. Each group on the horizontal axis has two bars — one per data set — shown in different colours. A legend identifies which colour represents which data set. Double bar graphs are used to compare two quantities across multiple categories simultaneously.
What are some double bar graph examples in everyday life? Common real-world double bar graph examples include monthly sales figures for two products, test scores for two classes across multiple subjects, rainfall in two cities over several months, the number of boys and girls in each year group at a school, and performance data for two teams across multiple games.
How do you read a double bar graph? Read the title and legend first to understand what is being measured and which colour represents which data set. Check the scale increment on the vertical axis. For each bar, trace horizontally from the bar top to the vertical axis and read the value. Always check the question carefully to know whether you need the value of a specific bar, the difference between two bars, or a total across multiple groups.
How is a double bar graph different from a single bar graph? A single bar graph shows one data set with one bar per group. A double bar graph shows two data sets with two bars per group. Double bar graphs always require a legend to identify the two data sets and are used specifically when comparing two related quantities across the same categories.
How do double bar graphs appear in AMC 8 problems? Double bar graphs appear in AMC 8 data interpretation questions, typically in the first fifteen problems. Common question types include reading specific values, finding the greatest or smallest difference between the two bars in a group, calculating totals or averages for one data set, finding ratios between totals, and calculating what fraction of the combined total one data set represents.
What is the most common mistake when reading a double bar graph? Misidentifying which bar belongs to which data set is the most common error. Always read the legend before reading any values. The second most common mistake is misreading the scale — checking the increment size on the vertical axis before reading the first value prevents this error.
How do double bar graphs relate to other AMC 8 graph types? The reading skills for double bar graphs — checking the scale, reading values accurately, interpreting the question precisely — transfer directly to other AMC 8 graph types including broken line graphs and stem and leaf plots. Students who practise all three graph types develop a consistent approach that works regardless of which format appears on the day.
Check out What is a Broken Line Graph? Examples, How to Read One and AMC Practice for an in-depth intro to line graphs with practice questions and solutions.


That’s a really helpful breakdown. I always found it tricky to distinguish between the bars when they were close in value.