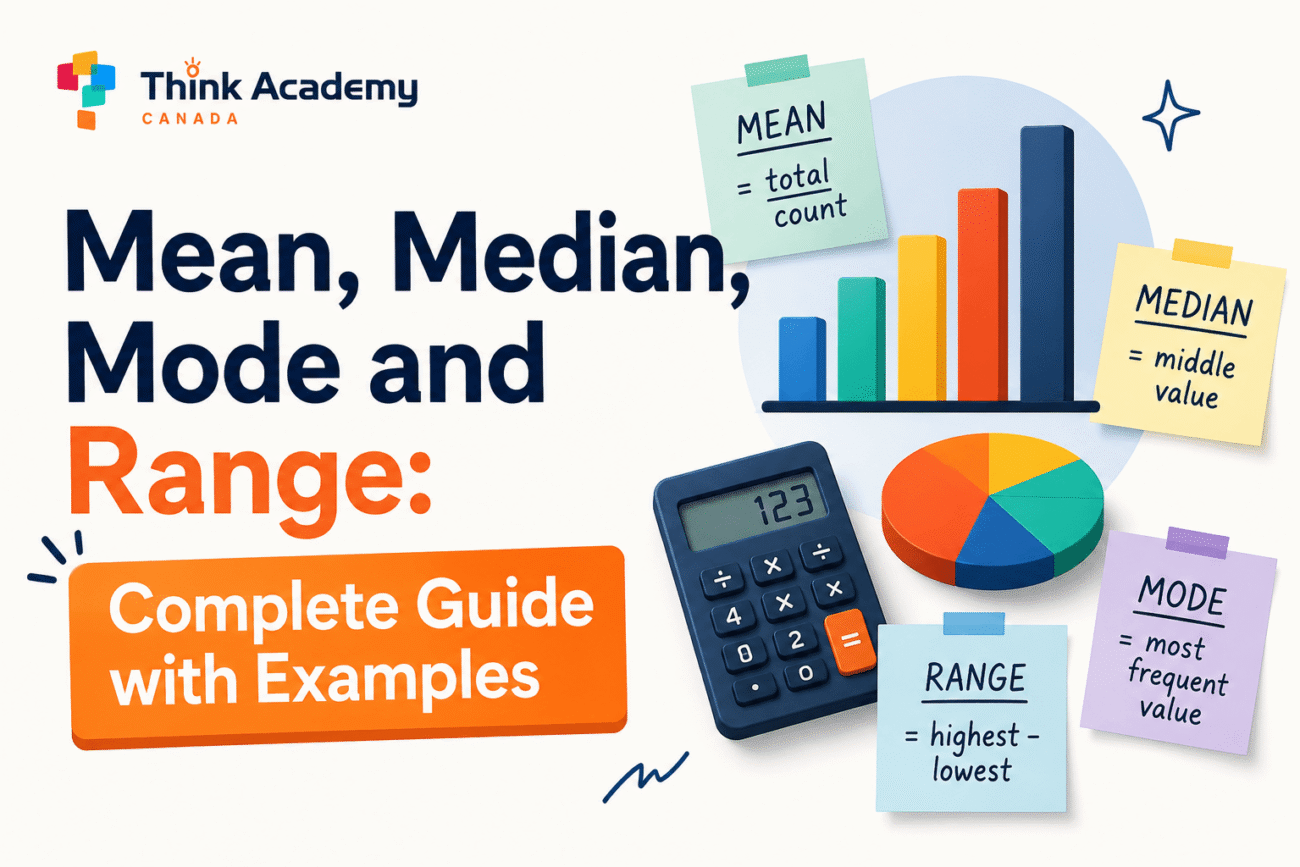
What is mode in math? What is range in math? How do mean and median differ — and when does each one actually matter? These four measures of central tendency are among the most tested concepts in Canadian mathematics from Grade 4 through Grade 9, appearing in EQAO assessments, the Gauss Contest, and every provincial curriculum from Ontario to Alberta. This guide explains all four clearly, with worked examples, common mistakes, and practice problems at every level.

What Is Mode in Math? Definition and Examples
The mode is the value that appears most often in a data set.
If one value appears more frequently than all others, that value is the mode. There is no calculation required — finding the mode is a matter of identifying which value repeats most.
Example: Data set: 3, 5, 7, 7, 9, 11
Count the frequency of each value:
- 3 → appears 1 time
- 5 → appears 1 time
- 7 → appears 2 times
- 9 → appears 1 time
- 11 → appears 1 time
Mode = 7
What if no value repeats?
If every value in a data set appears exactly once, the data set has no mode. This is a key part of understanding what is mode in math — the mode only exists when at least one value repeats.
Example: 2, 5, 8, 11, 14 → No mode
What if two values repeat equally?
If two values appear the same number of times (and more than any other), the data set has two modes — it is called bimodal. Understanding what is mode in math includes knowing that a data set can have more than one mode.
Example: 3, 3, 5, 7, 7, 9 → Mode = 3 and 7
What if more than two values repeat equally?
The data set is multimodal — it has more than two modes.
When Is Mode in Math Most Useful?
Mode is most useful for categorical or non-numerical data — where mean and median cannot be calculated. For example, if 30 students are asked their favourite colour and the results are: red (8), blue (12), green (5), yellow (5) — the mode is blue. Mean and median are meaningless here; mode is the only relevant measure.
Mode is also useful for identifying the most common value in a numerical distribution — for example, the most common shoe size in a store, or the most frequent score on a test.
What Is Range in Math?
The range is the difference between the largest and smallest values in a data set.Range=Maximum value−Minimum value
Range measures spread — how spread out the data is. It is the simplest measure of variability available.
Example: Data set: 4, 7, 9, 12, 18
- Maximum = 18
- Minimum = 4
- Range = 18 − 4 = 14
What does range tell you?
A large range means the data is widely spread — the highest and lowest values are far apart. A small range means the data is tightly clustered — the highest and lowest values are close together.
Example: Two classes both average 72% on a test.
- Class A: lowest mark 65%, highest mark 79% → Range = 14
- Class B: lowest mark 40%, highest mark 98% → Range = 58
The averages are identical — but Class B has far more variability in performance. Range captures this; mean alone does not.
Common mistake with range in math
Students often confuse range with the list of values in the data set. Range is a single number — the result of subtracting minimum from maximum. It is not a list, and it is not the maximum value alone.
What Is Mean in Math?
The mean is the average of all values in a data set.Mean=Number of valuesSum of all values
Example: Data set: 5, 8, 11, 14, 17
Sum = 5 + 8 + 11 + 14 + 17 = 55 Number of values = 5 Mean = 55 ÷ 5 = 11
When is mean most useful?
Mean is the most commonly used measure of central tendency and the most informative when the data is symmetrically distributed without extreme outliers. It uses every value in the calculation, which is both its strength and its weakness.
The problem with outliers
An outlier — an extreme value much higher or lower than the rest of the data — can distort the mean significantly.
Example: Salaries at a small company: $40,000 / $42,000 / $44,000 / $46,000 / $200,000
Mean = ($40,000 + $42,000 + $44,000 + $46,000 + $200,000) ÷ 5 = $74,400
The mean salary is $74,400 — but four of the five employees earn less than $47,000. The CEO’s salary ($200,000) pulls the mean up dramatically. In this case, median gives a more representative picture.
What Is Median in Math?
The median is the middle value when a data set is arranged in order from smallest to largest.
Finding the median: odd number of values
- Arrange all values in order
- The median is the middle value
Example: Data set: 9, 3, 7, 1, 5
Step 1 — Arrange in order: 1, 3, 5, 7, 9 Step 2 — Middle value: Median = 5
Finding the median: even number of values
When there is an even number of values, there is no single middle value. The median is the mean of the two middle values.
Example: Data set: 4, 7, 9, 12, 15, 20
Step 1 — Arrange in order: 4, 7, 9, 12, 15, 20 Step 2 — Two middle values: 9 and 12 Step 3 — Mean of middle values: (9 + 12) ÷ 2 = Median = 10.5
When is median most useful?
Median is most useful when the data contains outliers or is skewed — when a few extreme values would distort the mean. House prices, incomes, and test scores where a few very high or very low results exist are all contexts where median is more representative than mean.
This is why news reports typically use median household income rather than mean household income — a small number of extremely high earners would inflate the mean, making it unrepresentative of the typical household.
Mean vs Median vs Mode vs Range: Summary Table
| Measure | What it finds | How to calculate | Best used when |
|---|---|---|---|
| Mean | Average value | Sum ÷ count | Data is evenly distributed, no extreme outliers |
| Median | Middle value | Order then find centre | Data has outliers or is skewed |
| Mode | Most frequent value | Count frequencies | Categorical data or finding most common value |
| Range | Spread of data | Max − Min | Measuring variability alongside a central tendency |
Worked Examples: All Four Measures
Example 1 (Grade 5–6 level)
Data set: 6, 8, 4, 8, 10, 2, 8
Step 1 — Order the data: 2, 4, 6, 8, 8, 8, 10
Mean: (6 + 8 + 4 + 8 + 10 + 2 + 8) ÷ 7 = 46 ÷ 7 ≈ 6.6
Median: Middle value of 7 values = 8 (4th value)
Mode: 8 appears 3 times → Mode = 8
Range: 10 − 2 = 8
Example 2 (Grade 7–8 level)
Eight students score the following on a quiz: 72, 85, 91, 68, 85, 73, 90, 64
Step 1 — Order: 64, 68, 72, 73, 85, 85, 90, 91
Mean: (72 + 85 + 91 + 68 + 85 + 73 + 90 + 64) ÷ 8 = 628 ÷ 8 = 78.5
Median: (73 + 85) ÷ 2 = 79
Mode: 85 appears twice → Mode = 85
Range: 91 − 64 = 27
Example 3 — Choosing the right measure (Grade 8–9 level)
A neighbourhood has 9 households with annual incomes of: $48,000 / $52,000 / $55,000 / $58,000 / $61,000 / $62,000 / $64,000 / $67,000 / $450,000
Mean: ($48,000 + $52,000 + $55,000 + $58,000 + $61,000 + $62,000 + $64,000 + $67,000 + $450,000) ÷ 9 = $977,000 ÷ 9 ≈ $108,556
Median: 5th value = $61,000
Mode: No value repeats → No mode
Range: $450,000 − $48,000 = $402,000
Which measure best represents the typical household income? The median ($61,000) — the $450,000 outlier distorts the mean dramatically, making it unrepresentative of 8 of the 9 households.
Common Mistakes: What Is Mode in Math vs Mean, Median and Range
Forgetting to order the data before finding the median. The most frequent error at every grade level. The median is the middle value of an ordered list — finding the middle of an unordered list produces the wrong answer every time.
Confusing range in math with the list of values. Range is a single number. Students who write “the range is 3 to 18” have confused range with the span of the data. The correct statement is “the range is 15” (18 − 3 = 15).
Saying there is no mode when all values are equal. If every value appears the same number of times, every value is a mode — not “no mode.” No mode means no value appears more than once.
Using mean when outliers are present. A student asked “which measure best represents this data?” who chooses mean without checking for outliers will lose marks on EQAO and Gauss-style questions that specifically test this understanding.
Calculating mean with the wrong denominator. Dividing by the number of unique values instead of the total count of values in the data set. Count every entry, including repeated ones.
Mean, Median, Mode and Range in the Ontario Curriculum
These four measures appear across multiple grade levels in the Ontario mathematics curriculum:
- Grade 4–5: Introduction to mean as average; mode and range in simple data sets
- Grade 6: EQAO Grade 6 tests data management including mean, median, mode, and range interpretation — see our EQAO Grade 6 complete guide
- Grade 7: Comparing measures of central tendency; choosing appropriate measure; understanding effect of outliers
- Grade 8: Scatter plots and trend analysis; mean, median, and mode in context; data analysis in the Grade 8 math curriculum
- Grade 9: Data strand in MTH1W; interpreting statistical claims — see our Ontario Grade 9 math curriculum guide
For a full picture of how data management builds across the Ontario elementary years, see our Ontario math curriculum overview.
Mean, Median, Mode and Range in Mathematics Competitions
These concepts appear in the Gauss Contest and AMC 8 in more demanding forms than standard curriculum problems. Students who fully understand what is mode in math — and how it differs from mean and median — are better equipped for these competition question types. Competition questions typically involve:
- Finding a missing value given the mean of a data set
- Determining which measure of central tendency changes when a value is added or removed
- Choosing the most appropriate measure for a given context and justifying the choice
- Working with weighted means or grouped data
Example (Gauss-style): The mean of five numbers is 12. Four of the numbers are 8, 11, 14, and 16. What is the fifth number?
Solution: Sum of all five = 5 × 12 = 60. Sum of four known numbers = 8 + 11 + 14 + 16 = 49. Fifth number = 60 − 49 = 11.
This type of question — finding a missing value from a known mean — is one of the most common data management question types in competition mathematics at the Grade 7–8 level.
Practice Problems
Work through these problems before checking the answers below.
Set A — Grade 5/6 Level
Data set: 3, 8, 5, 8, 2, 9, 8, 4
- What is the mode? ___
- What is the range? ___
- What is the mean? ___
- What is the median? ___
Set B — Grade 7/8 Level
Data set: 14, 22, 17, 31, 14, 28, 19, 22, 14
- What is the mode? ___
- What is the range? ___
- What is the mean? ___
- What is the median? ___
- A tenth value of 100 is added to the data set. Which measure changes the most — mean, median, or mode? ___
Set C — Application Level
- The mean of 6 numbers is 15. Five of the numbers are 12, 18, 9, 21, and 14. What is the sixth number? ___
- A data set has a mean of 10, a median of 9, and a mode of 8. Is the data skewed left, right, or symmetric? ___
- A store tracks daily sales: $320, $285, $310, $295, $1,200, $305, $290. Which measure best represents typical daily sales? Why? ___
Answers:
Set A: 1) 8 2) 7 (9 − 2) 3) 47 ÷ 8 = 5.875 4) Order: 2,3,4,5,8,8,8,9 → (5+8)÷2 = 6.5
Set B: 5) 14 6) 17 (31 − 14) 7) 181 ÷ 9 ≈ 20.1 8) Order: 14,14,14,17,19,22,22,28,31 → 19 9) Mean — it is most affected by the extreme outlier
Set C: 10) 6 × 15 = 90; 12+18+9+21+14 = 74; sixth = 16 11) Skewed right (mean > median > mode indicates right skew) 12) Median — the $1,200 outlier distorts the mean; median ($305) better represents the typical day
How to Remember Mean, Median, Mode and Range
Students looking for a quick memory aid:
Mean — think of “mean” as the mathematical average. It is the most work to calculate (add everything, then divide).
Median — think of the median strip on a highway — it runs down the middle. The median is the middle value.
Mode — mode and most both start with “mo.” The mode is the most frequent. When students ask what is mode in math, the simplest answer is: the value that shows up the most.
Range — the range of a mountain range is how far it stretches from one end to the other. The range in math is how far the data stretches from minimum to maximum.
How Think Academy Helps with Data Management
Think Academy Canada works with students in Grades 1 through 12, and data management — including mean, median, mode, and range — is part of the structured curriculum at every grade level where it appears.
For students preparing for the EQAO Grade 6 assessment, the Gauss Contest, or simply working through Grade 7 and 8 data units, our diagnostic-led approach identifies specifically which data concepts have gaps. Whether a student is confused about what is mode in math, unsure how to find the median with an even number of values, or unclear on when to use mean vs median, our instructors address those gaps directly.
The free assessment takes 20 minutes and produces a written feedback report covering all major curriculum strands — including data management. It is the right starting point for any student who wants to know whether their understanding of mean, median, mode, and range is secure enough for what comes next.
Frequently Asked Questions
What is mode in math? The mode is the value that appears most frequently in a data set. A data set with no repeating values has no mode. A data set where two values tie for most frequent is bimodal — it has two modes.
What is range in math? The range is the difference between the largest and smallest values in a data set: Range = Maximum − Minimum. It measures how spread out the data is.
What is the difference between mean and median? Mean is the mathematical average (sum divided by count); median is the middle value when data is ordered. They are often similar for symmetrical data, but diverge when outliers are present — in which case median is usually more representative.
How do you find the median with an even number of values? Order the data, identify the two middle values, and calculate their mean. For example, with 8 values, the median is the average of the 4th and 5th values.
When should you use median instead of mean? When the data set contains outliers — extreme values much higher or lower than the rest — median is more representative than mean. Income, house prices, and any data set with one or two very large or very small values are typical contexts where median is preferred.
What does it mean if the mode and mean are very different? It often indicates the data is skewed — with a cluster of values at one end and a tail at the other. If mean > median > mode, the data is skewed right (a tail of high values). If mean < median < mode, it is skewed left.
Do mean, median, mode and range appear on EQAO? Yes. All four measures appear in EQAO Grade 6 and are tested in the data management strand. Mean and median also appear in Grade 9 EQAO (MTH1W data strand). For EQAO-specific preparation, see our EQAO Grade 6 complete guide and EQAO Grade 9 complete guide.
See our related guides: EQAO Grade 6 complete guide · EQAO Grade 9 complete guide · Grade 6 math curriculum Ontario · Grade 7 math curriculum Ontario · Grade 8 math curriculum Ontario · Ontario Grade 9 math curriculum · Grade 7 math worksheets · Gauss math contest guide · AMC 8 guide · Ontario math curriculum overview
Build the data management skills that EQAO and competitions test. Start with a free assessment.